


Decoding Crypto Charts: A Comprehensive Guide to Mastering Chart Reading in the Cryptocurrency Market
The cryptocurrency market is known for its dynamic nature, and navigating it successfully requires a deep understanding of various tools and techniques. Among these, the ability to read crypto charts is paramount for any trader or investor. In this guide, we’ll delve into the intricacies of decoding crypto charts, empowering you to make informed decisions in the volatile world of digital assets.
Table of Contents
Understanding the Basics of Crypto Charts
To begin our journey, let’s establish a solid foundation by exploring the fundamental elements of how to read crypto charts.
Types of Crypto Charts
There are three main types of crypto charts: line charts, bar charts, and candlestick charts. Each provides a unique perspective on price movements, allowing traders to choose the one that aligns with their preferences and analysis style.
Timeframes and Intervals
Timeframes play a crucial role in chart analysis. Understanding the significance of different time intervals, such as daily, weekly, or hourly charts, enables traders to zoom in or out for a more comprehensive view of market trends.
Price Scales
Price scales represent the value of the cryptocurrency being analyzed. Learning to interpret these scales is essential for accurately gauging price movements and identifying potential entry or exit points.
Deciphering Candlestick Patterns
Candlestick charts are widely favored in the crypto community due to their ability to convey a wealth of information in a single glance. Let’s explore some common candlestick patterns and their implications.
Bullish Patterns
Bullish candlestick patterns indicate a potential upward trend. Recognizing patterns like the hammer, engulfing, and morning star can help traders anticipate positive price movements.
Bearish Patterns
Conversely, bearish candlestick patterns signal a potential downward trend. Traders should be familiar with patterns such as the shooting star, hanging man, and evening star to identify potential reversals or downturns.
Indecision Patterns
Indecision patterns, like doji and spinning tops, suggest market uncertainty. Traders should be cautious when these patterns emerge, as they could precede a significant price swing in either direction.
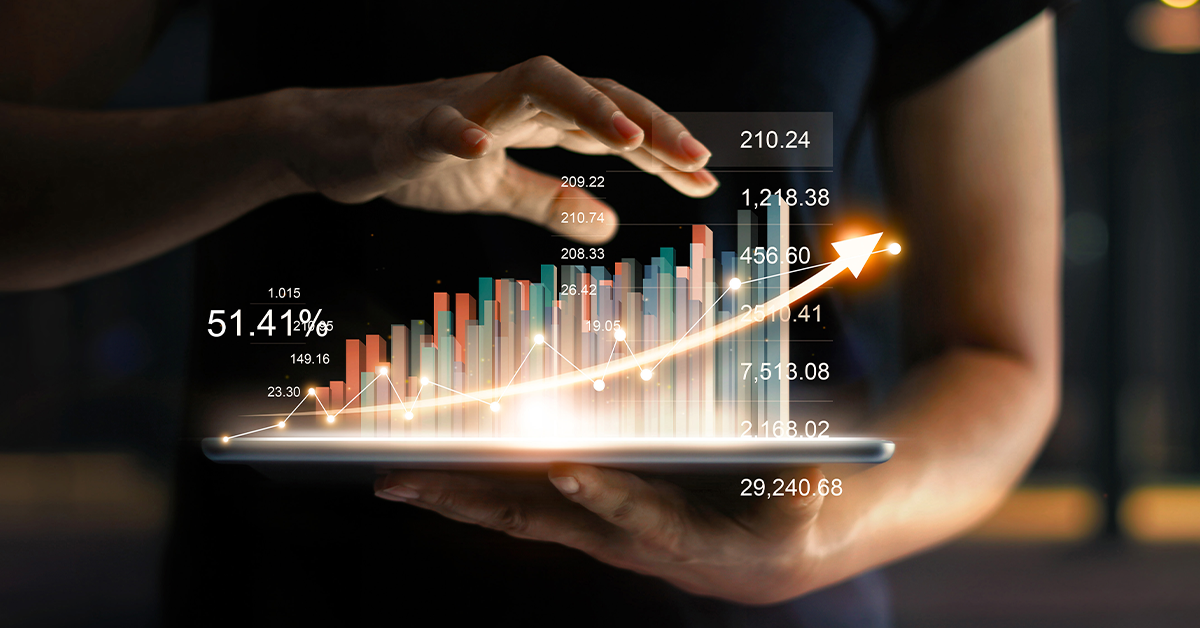
Technical Indicators and Oscillators
In addition to candlestick patterns, technical indicators and oscillators provide valuable insights into market trends and momentum.
Moving Averages
Moving averages smooth out price data to identify trends more easily. Traders commonly use simple moving averages (SMA) and exponential moving averages (EMA) to spot potential entry or exit points.
Relative Strength Index (RSI)
The RSI is a momentum oscillator that measures the speed and change of price movements. Understanding RSI levels can help traders identify overbought or oversold conditions, guiding them in making strategic decisions.
MACD (Moving Average Convergence Divergence)
The MACD is a trend-following momentum indicator that shows the relationship between two moving averages. Traders use MACD signals to identify potential trend reversals and confirm the strength of existing trends.
Drawing Trendlines and Support/Resistance Levels
Trendlines and support resistance levels are crucial tools for chart analysis, helping traders identify potential trend reversals and significant price levels.
Trendlines
Drawing trendlines involves connecting the highs or lows on a chart, revealing the direction of the prevailing trend. Traders can use trendlines to identify potential entry points in the direction of the trend.
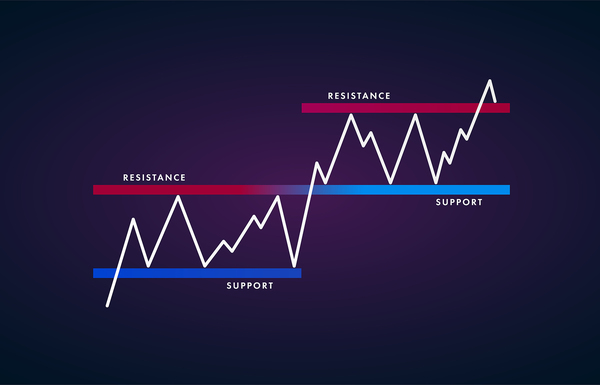
Support and Resistance
Support and resistance levels represent key price levels where buying or selling pressure is likely to emerge. Recognizing these levels can help traders set realistic profit targets and stop-loss orders.
Risk Management Strategies
No guide to reading crypto charts is complete without addressing the importance of risk management. Implementing effective risk management strategies is crucial for preserving capital and ensuring long-term success.
Setting Stop-Loss Orders
Traders should establish clear stop-loss orders based on their risk tolerance and analysis of chart patterns. This practice helps limit potential losses and prevents emotional decision-making during market fluctuations.
Position Sizing
Determining the appropriate position size for each trade is a key aspect of risk management. By carefully calculating the percentage of capital at risk in each trade, traders can optimize their risk-reward ratio.
Diversification
Diversifying a cryptocurrency portfolio across different assets reduces the impact of a single asset’s poor performance. This strategy minimizes risk and enhances the potential for overall portfolio growth.
Frequently Asked Questions
What is the importance of reading crypto charts?
Understanding crypto charts is crucial for making informed decisions in the cryptocurrency market. Charts provide insights into price trends, patterns, and potential market movements.
What are the different types of crypto charts?
There are three main types of crypto charts: line charts, bar charts, and candlestick charts. Each type presents price data in a unique format, catering to different preferences and analysis styles.
How do I choose the right timeframe for analysis?
The choice of timeframe depends on your trading or investment strategy. Short-term traders may prefer hourly or daily charts, while long-term investors may focus on weekly or monthly charts.
What are candlestick patterns, and why are they important?
Candlestick patterns represent visual cues on a chart that indicate potential market movements. Recognizing these patterns helps traders anticipate price trends and make timely decisions.
Can you explain bullish and bearish candlestick patterns?
Bullish candlestick patterns suggest potential upward trends, while bearish patterns indicate potential downward trends. Examples include hammers, engulfing patterns for bullish signals, and shooting stars for bearish signals.
Conclusion
In conclusion, mastering the art of reading crypto charts is a fundamental skill for anyone involved in the cryptocurrency market. By understanding chart types, candlestick patterns, technical indicators, trendlines, and reading crypto charts strategies, you can navigate the complexities of this dynamic market with confidence. Continuous learning and practical application of these skills will undoubtedly contribute to your success as a crypto trader or investor.